


I'm a Computer Science graduate from Arizona State University (May 2026, 3.76 GPA, magna cum laude, minor in Data Science), based in Tempe, AZ and open to relocation.
Open to: Data Analyst, Data Engineer, Data Scientist and AI / ML Engineer roles. Approved OPT · 3-yr STEM.
Portfolio: pavanmanjunath18.github.io
I came up through analytics: dashboards, SQL, and working out what a metric actually measures. From there I moved toward the parts that make analytics trustworthy and useful: pipelines that don't silently break, models that are evaluated honestly, and services that put a result in front of someone who can act on it. Lately that has meant retrieval-augmented generation and ML evaluation as much as dashboards.
The instinct underneath all of it is the same: take the noise, find the signal, and put it to work.
I use AI tools in my development process. They help me move faster, but I try not to use them as a reason to understand less.
- Exploratory data analysis and making sense of messy datasets
- Building dashboards and visualizations that communicate something true
- Writing SQL that does what you think it does
- Data pipelines and data quality: cleaning, validation, and the unglamorous parts of working with real data
- Evaluating models honestly: time-based validation, leakage checks, and reporting the numbers that don't flatter the model
- Applying ML and AI to practical problems, from a fairness-aware credit model to a local RAG assistant
- Thinking through what a metric actually measures
- Evaluating retrieval and LLM systems, not just wiring them together
- Production patterns for AI applications: packaging, CI, latency, reliability, observability
- Analytics engineering with dbt and DuckDB
- Fairness and drift monitoring for models that make decisions about people
- AWS for data and AI work (I hold the Cloud Practitioner and AI Practitioner certifications, and want the hands-on depth to match)
I find learning by building more useful than learning by reading. So most of what's below came from trying to build something real and running into things I didn't understand.
Credit Decisioning Engine · Live Dashboard
An approve-or-decline engine trained on 618,584 LendingClub loans and judged on profit, losses and fairness rather than accuracy alone. It trains on 2007 to 2013, tunes on 2014 and reports only on unseen 2015 loans, with application-time features enforced by leakage tests. At the same approval rate it earns $6.4M more than ranking by LendingClub's own grade, and declining the riskiest 12% lifts profit 13.8% at a 4% cost of funds. Three dashboards cover approval strategy, an applicant explorer with plain-English decline reasons, and fairness and drift monitoring.
Python DuckDB pandas scikit-learn XGBoost SHAP pytest Chart.js Vercel
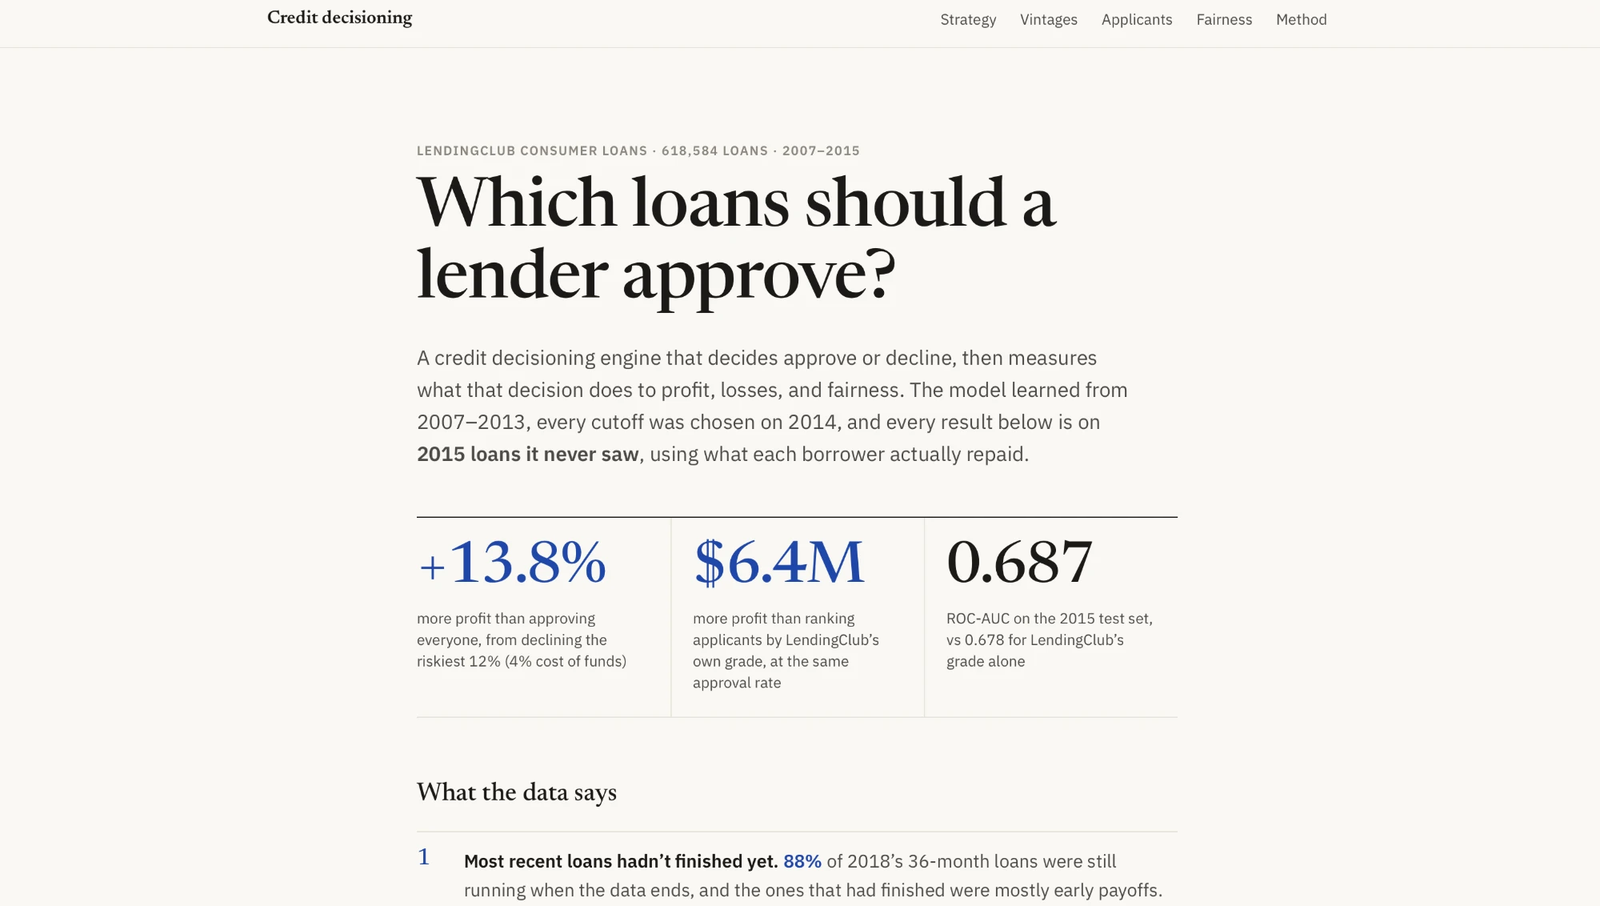
Signal: Data Scientist / Risk Analytics · time-based validation, leakage prevention, profit-optimized thresholds, fairness and drift monitoring, explainable decisions.
ReadmitScope US · Live Dashboard
Healthcare analytics project on CMS Medicare hospital readmissions. I built the full workflow: live CMS data pull, cleaning, data quality logs, notebooks, statistical analysis, enrichment with hospital ownership/star ratings, and a deployed React dashboard.
Python pandas scipy scikit-learn React TypeScript Recharts Vercel
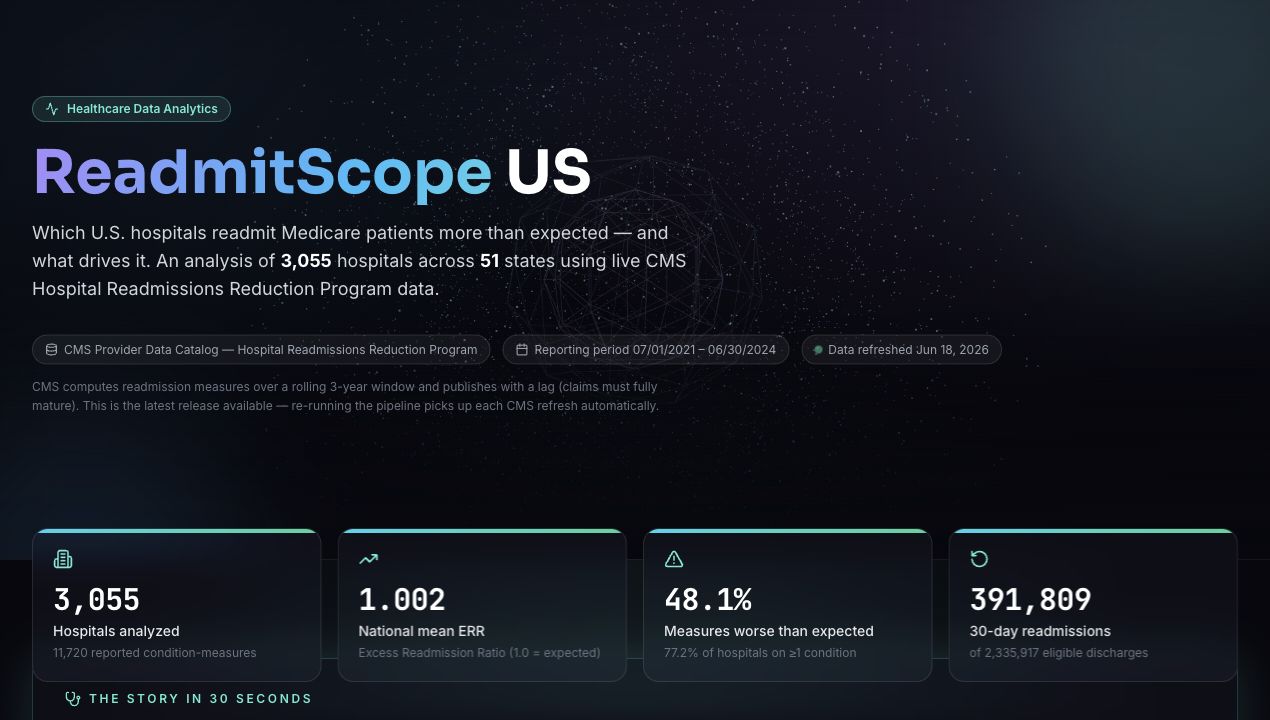
Signal: Data Analyst / Data Scientist · exploratory analysis, statistical testing, healthcare metric framing, deployed BI-style dashboard.
Interactive 3D cardiovascular risk explorer using the UCI Cleveland Heart Disease dataset. The app projects 297 patients into PCA space, supports k-means clustering, trains a logistic regression risk model, and lets users simulate a patient to inspect risk and top contributing features.
React TypeScript Three.js PCA k-means Logistic Regression Data Visualization
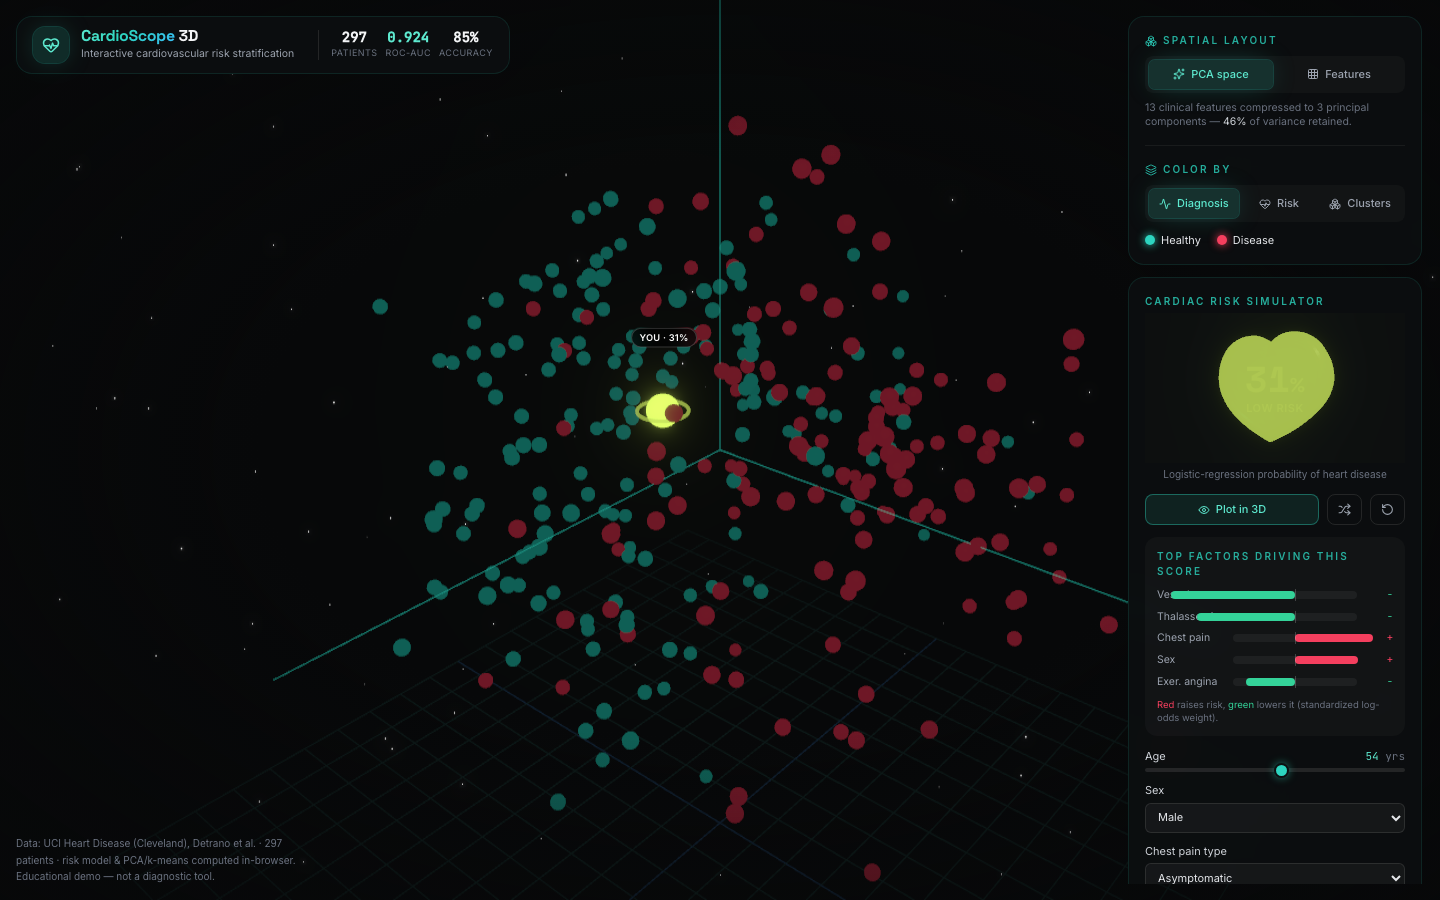
Signal: Data Scientist / Visualization Engineer · dimensionality reduction, clustering, predictive modeling, explainable feature contributions, interactive analytics UI.
Post-acquisition retail data integration project that consolidates parent and acquired-company data into a Databricks lakehouse. Implements Bronze/Silver/Gold layers, Delta MERGE upserts, S3 landing-zone ingestion, incremental processing, grain alignment, and a gold star-schema analytics view.
Databricks PySpark Delta Lake AWS S3 SQL Unity Catalog Data Engineering
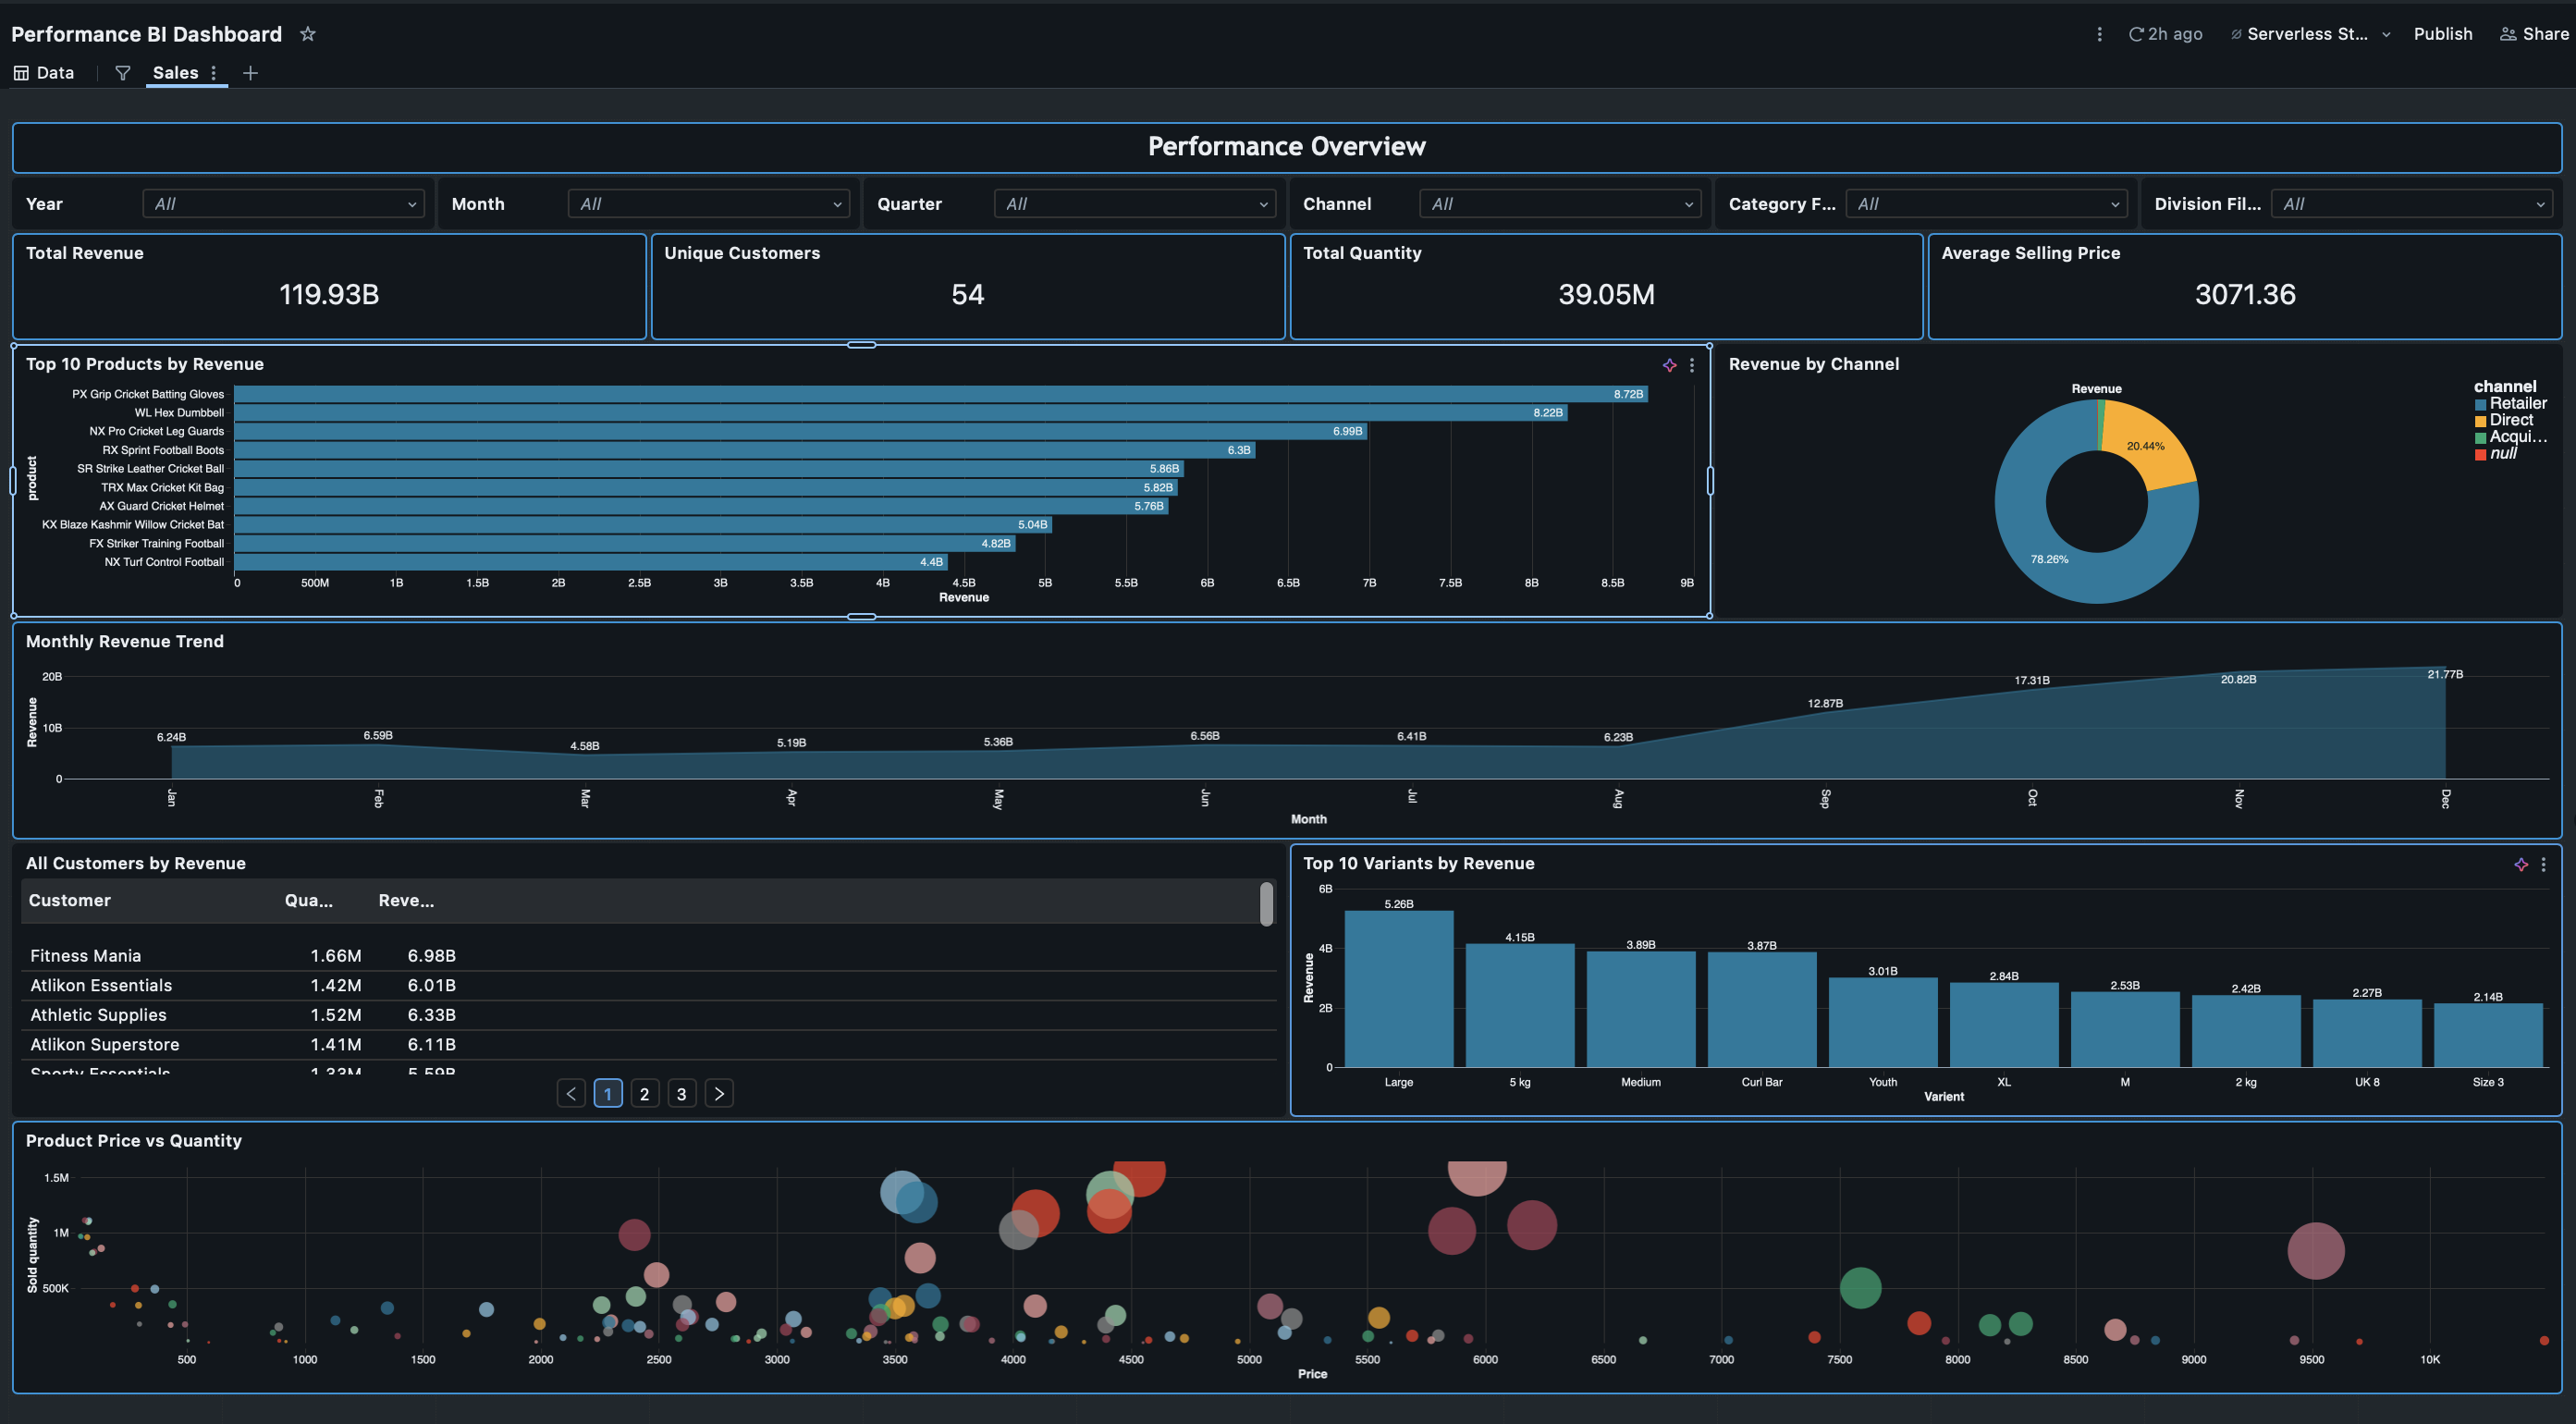
Signal: Data Engineer / Analytics Engineer · medallion architecture, schema harmonization, incremental loads, quality remediation, dashboard-ready data modeling.
At ASU's Social Embeddedness office I was a Community Engagement Data Analyst (Sep 2024 to May 2026). I administered and validated 2,300+ engagement activities across 32 ASU units and 650 community organizations, raising required-field completeness from 78% to 96%. I built Tableau Prep pipelines and 6 dashboards tracking 10 institutional KPIs, cutting monthly reporting prep from 4 days to 6 hours. I also built a Python and GPT-4o mini workflow that classifies stakeholder narratives into 12 standardized themes with 91% agreement against human review. That work shaped how I think about analytics: the visualization is the easy part, the hard part is understanding what question you're actually trying to answer.
For my capstone I was the Data Engineer on a high-volume MySQL production database for DigiClips (Aug 2025 to Apr 2026). I automated retention cleanup with the Event Scheduler, removed duplicate and bad-timestamp records, and refactored the search stored procedures, cutting median query latency 64% (1.8s to 650ms) on a 500K-record test database.
In summer 2025 I was a Data Analyst intern at Food Forest AI, where I built a pipeline that converted 650+ supplier PDFs into standardized JSON profiles across 15 attributes, cutting supplier onboarding from 12 to 4 minutes. I also ran Python and SQL quality checks across 2,500+ profiles (420 missing fields, 275 formatting anomalies, 110 duplicates) and built Power BI dashboards on 8,000+ B2B search events. I learned that data quality problems are mostly discovered after someone has already trusted the bad data.
I'm from India, and I've been navigating school and career in the US as an international student. It's taught me to be resourceful and to not take shortcuts when I can't afford them.
- AWS Certified AI Practitioner (Sep 2026) · verify on Credly
- AWS Certified Cloud Practitioner (Sep 2026) · verify on Credly
- How you tell whether an ML system actually works: evaluation design, leakage, and the gap between a validation score and reality
- What retrieval changes about what a small local model can answer
- Why distributed systems fail in non-obvious ways
- How operational data can improve human decision-making (not replace it)
- The design of systems that are debuggable, not just functional
- What makes an AI feature actually useful in practice vs. impressive in a demo
- The gap between analytics and engineering, and what lives in it
- Off the clock: hiking and national parks (I've hiked Humphreys Peak, the highest point in Arizona at 12,633 ft)
Good analysis and good engineering both require the same thing: understanding the problem well enough to know which simplifications are safe.
The most useful AI tools are the ones that make people better at their jobs. The rest are demos.
"It works on my machine" is not the same as working.
Email: pvmmallipudi@gmail.com LinkedIn: linkedin.com/in/pavan-mallipudi Portfolio: pavanmanjunath18.github.io
Still figuring things out. Enjoying the process.