








const aka = {
  name: "Aka",
  username: "akaanakbaik",
  location: "Sumatra Barat, Indonesia 🇮🇩",
  role: "Student Developer",
  focus: ["Web Development", "Linux", "Automation", "AI", "Bots", "Cloud"],
  motto: "still water, flowing. — air tenang menghanyutkan"
};
I build practical projects while learning: web apps, bot systems, Linux/VPS tools, automation, and AI-powered experiments.
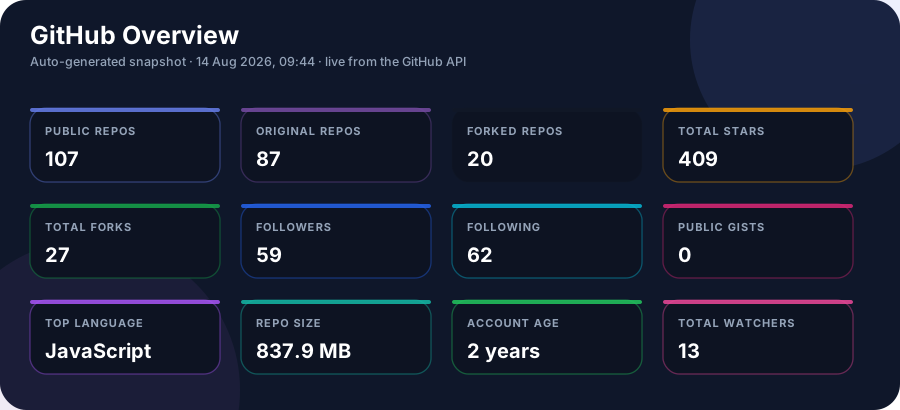


This section is generated from the GitHub REST and GraphQL APIs. One workflow rebuilds the entire snapshot — scheduled at minute 17 of every hour, plus every push that touches the profile and manual dispatch — and publishes it only after the census is independently recounted and every badge passes validation. GitHub delays scheduled runs on this repository by hours at times, so every number here carries its own publication time: what you see is the last snapshot that actually completed and passed, not a promise about when the next one lands. Badge delivery uses a short cache to surface each completed snapshot promptly.
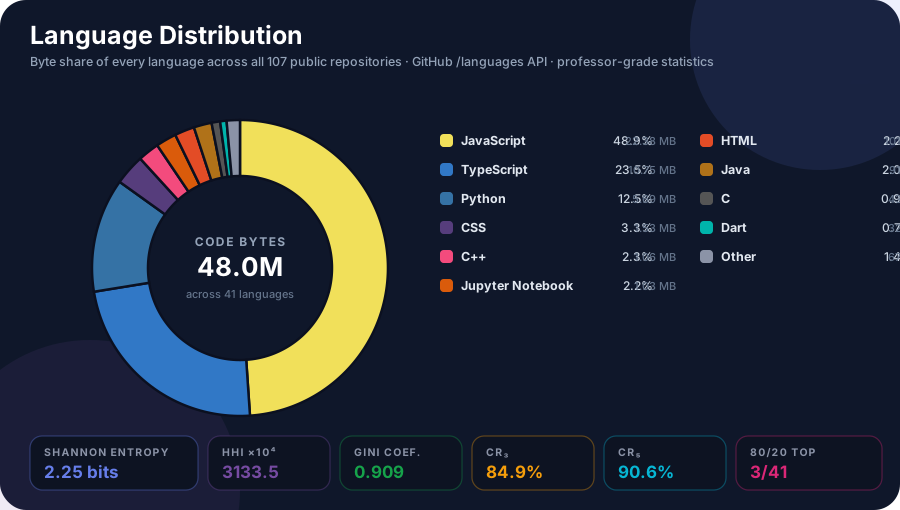
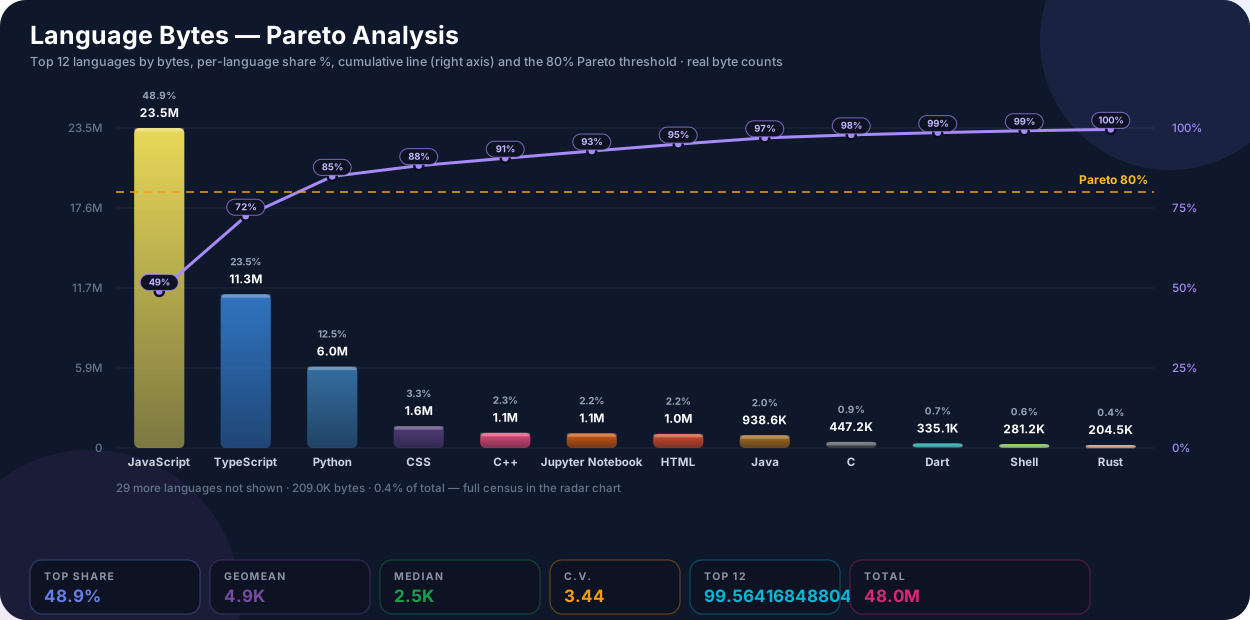
Language shares use the GitHub
/languagesbyte counts for every public repository. The charts include concentration, entropy, Gini, coefficient of variation, and Pareto calculations instead of estimates from repository names.



Full Code Census. Every tracked, regular source file on the default branch of every public repository is read without a file-size limit, including tracked dependencies and generated source when present. “Lines” means non-empty code lines; “characters” means Unicode code points; notebooks contribute only their code cells. Empty files are counted as files with zero lines and characters. Symlinks do not contain source themselves and are recorded separately. Any unreadable, binary, or unparsable source file fails the snapshot rather than creating a partial total; the workflow then independently recounts every cached clone before publication.
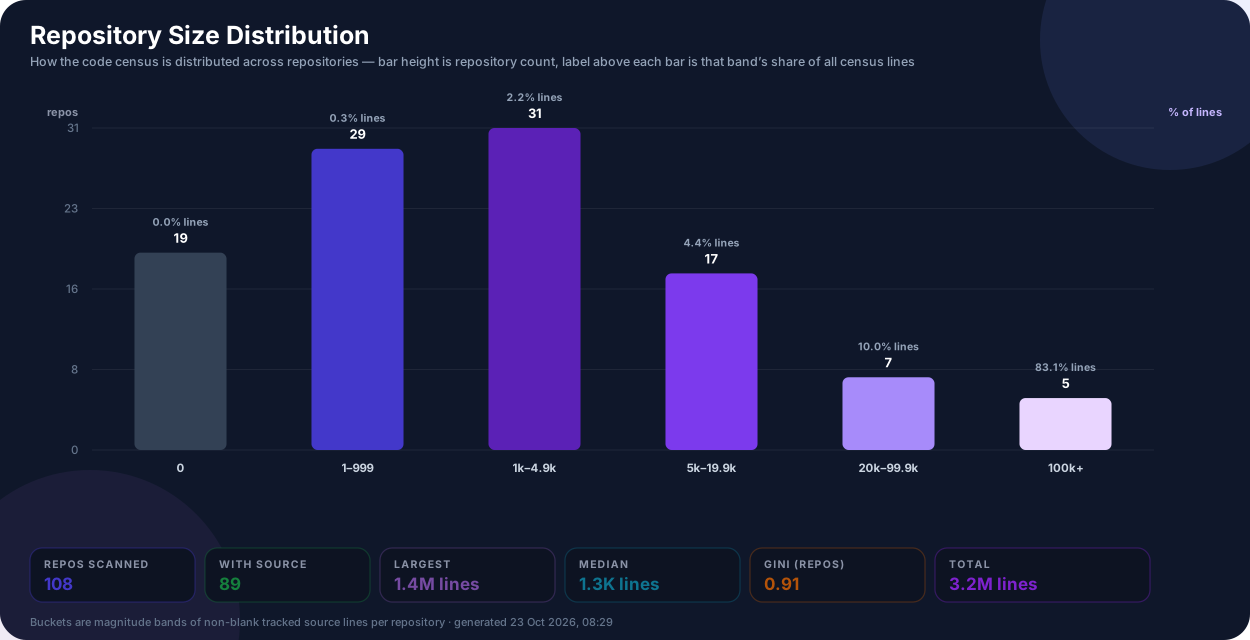
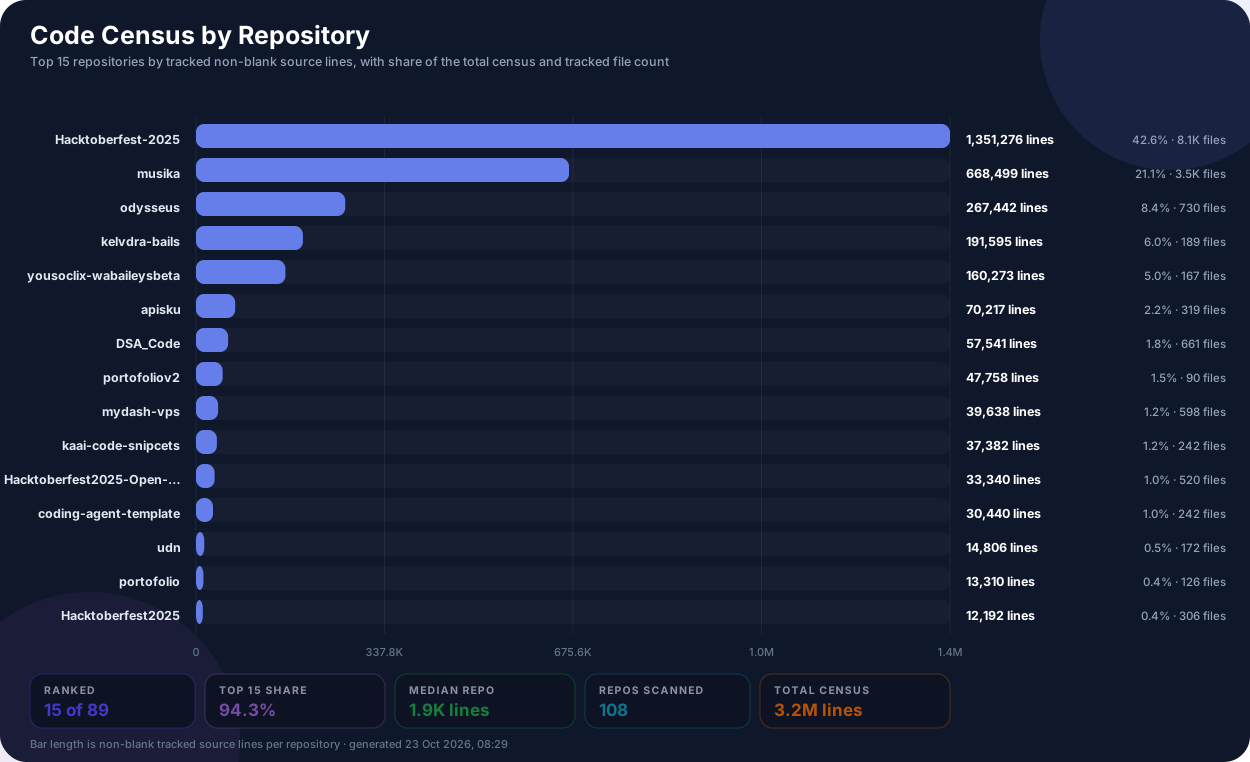
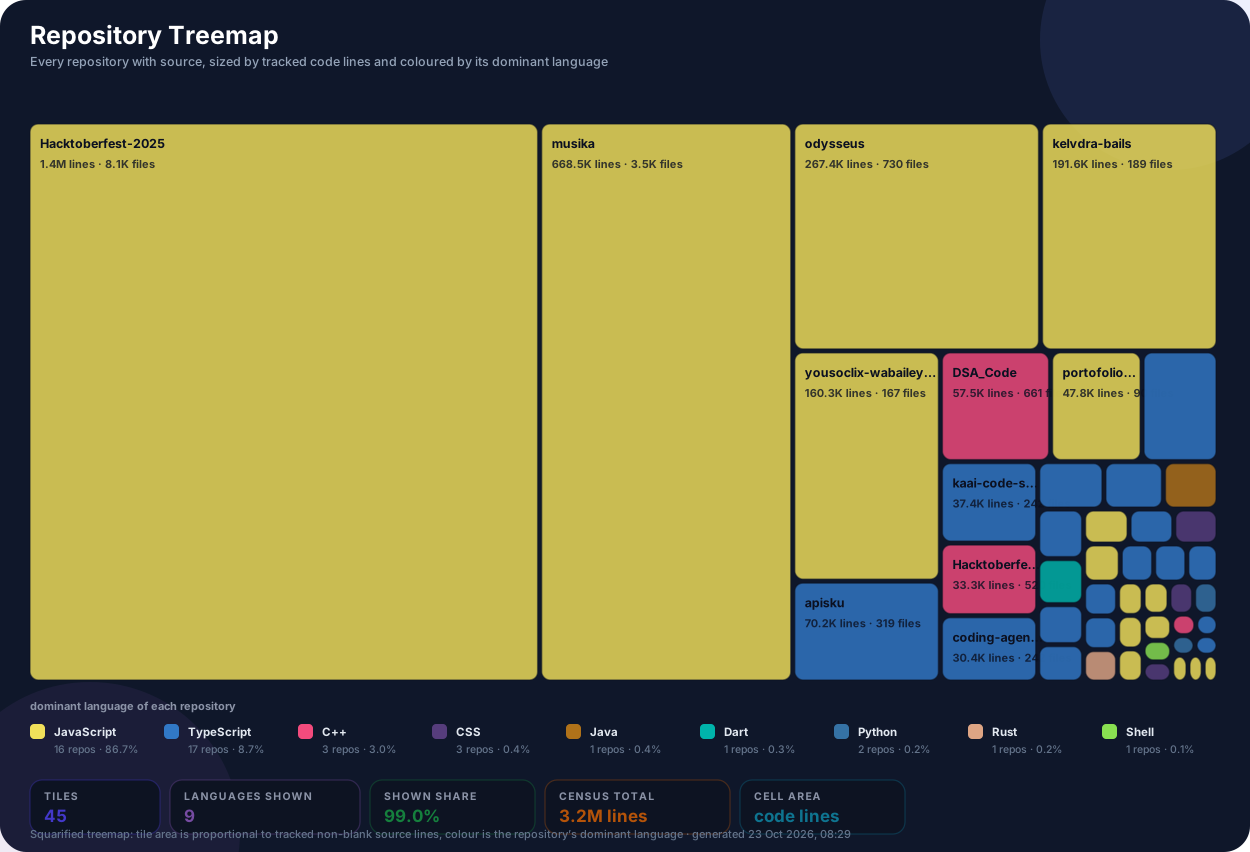
These three graphs are projections of the same single Code Census pass, never a second estimate. Bucket heights are real repository counts, bar lengths are real non-blank tracked source lines, and in the treemap every tile's area is directly proportional to that repository's tracked code lines while its colour is the dominant language found by reading those files. Repositories with no tracked source are counted as zero rather than dropped, so the distribution always reconciles with the published totals.
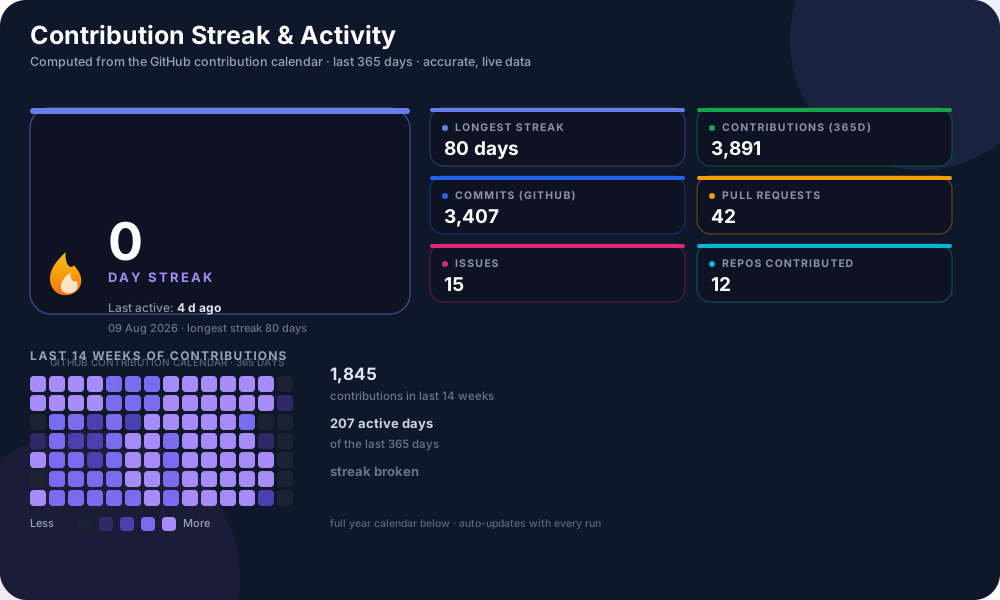
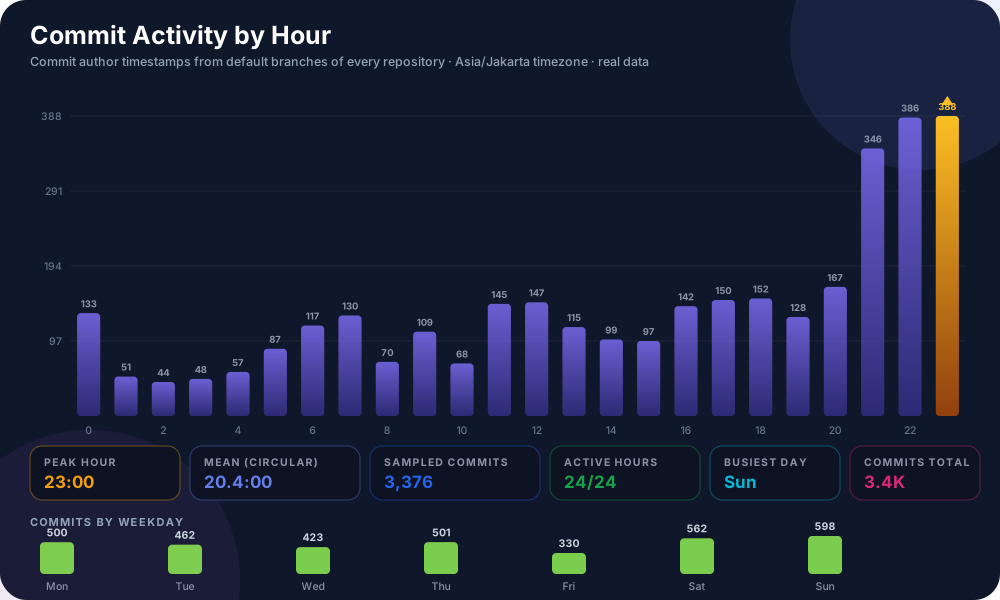
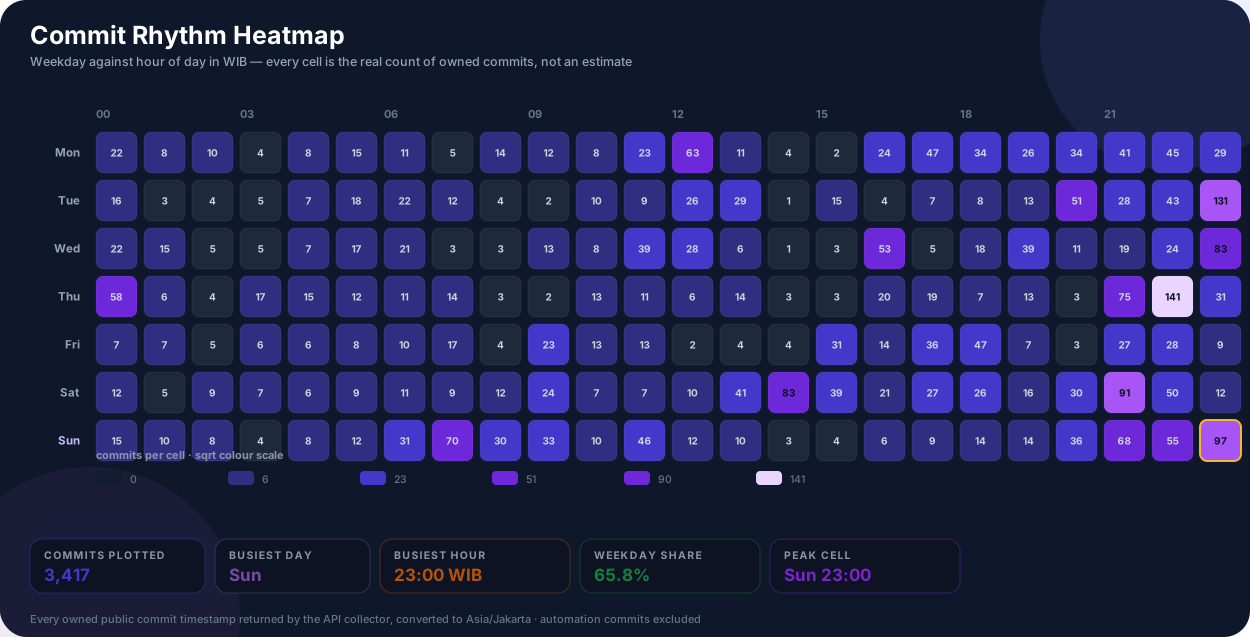
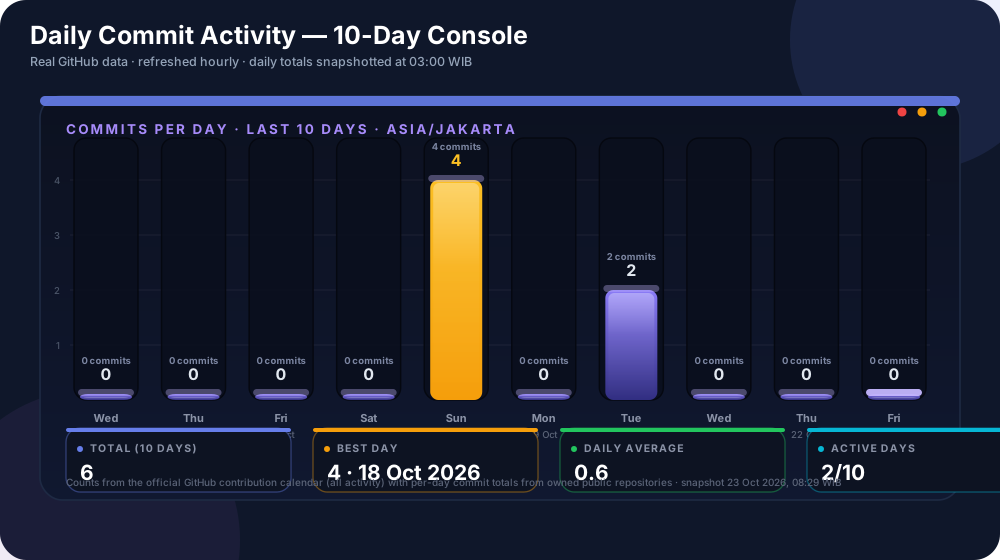
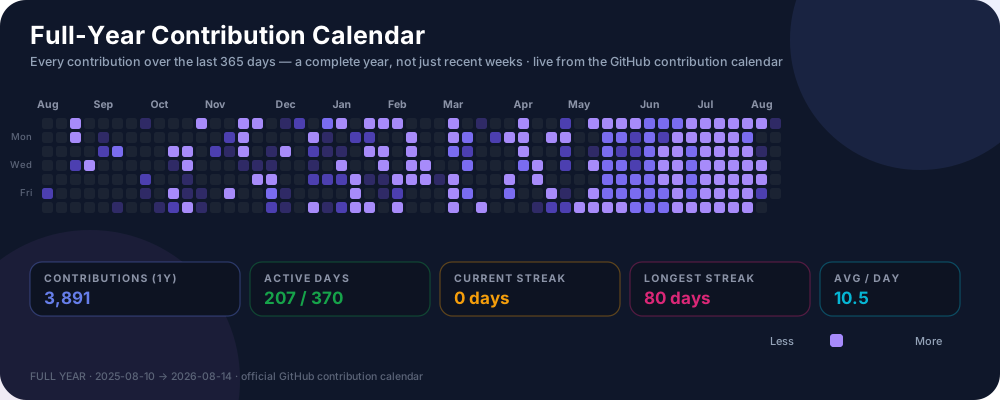


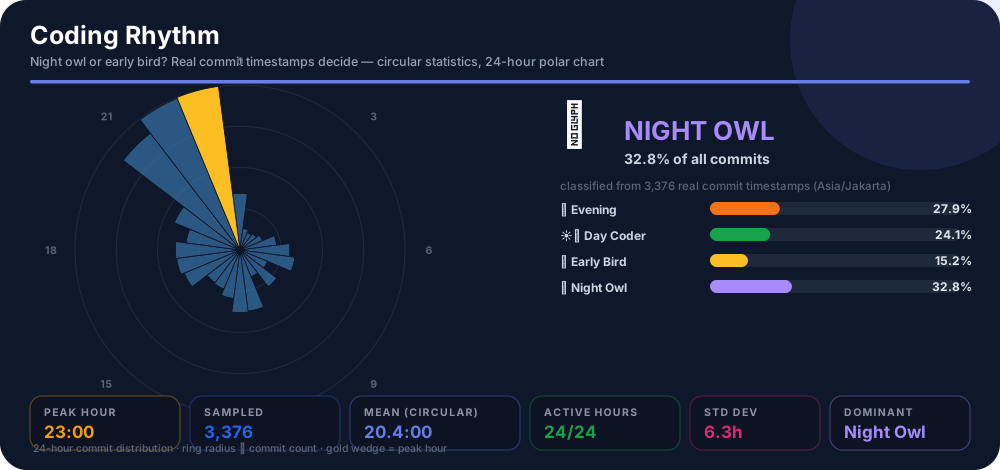
Streaks come from the official contribution calendar. Commit hours use the complete owned public commit history returned by the API collector, converted to Asia/Jakarta, with known automation commits excluded so scheduled updates do not inflate personal activity. Any incomplete API collection aborts publication instead of displaying a partial metric.
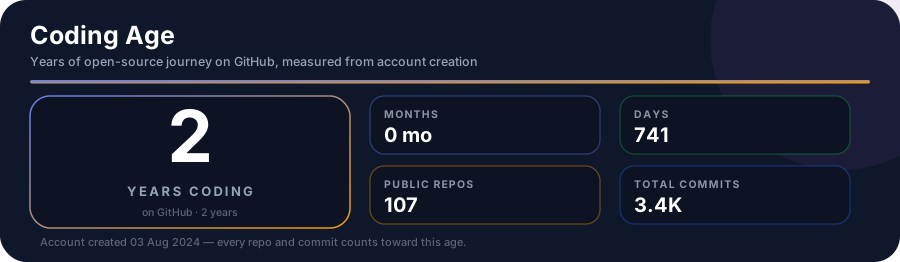
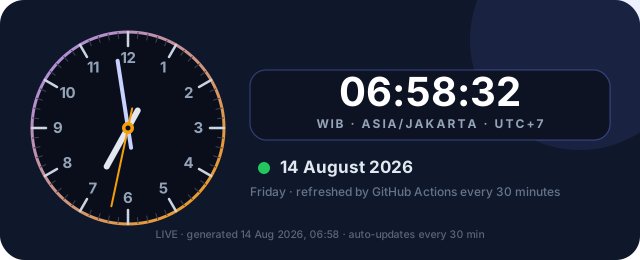


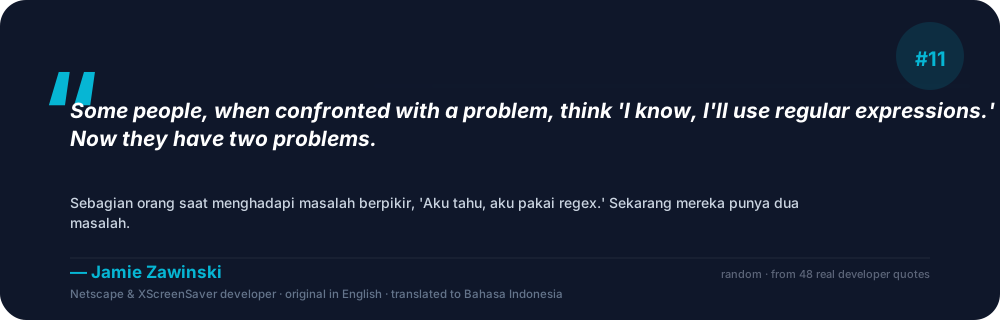
The clock and quote are refreshed by the same scheduled snapshot as every other number above. The README therefore reports a verified publication snapshot, stamped with its own generation time, rather than claiming second-by-second updates from a static file.
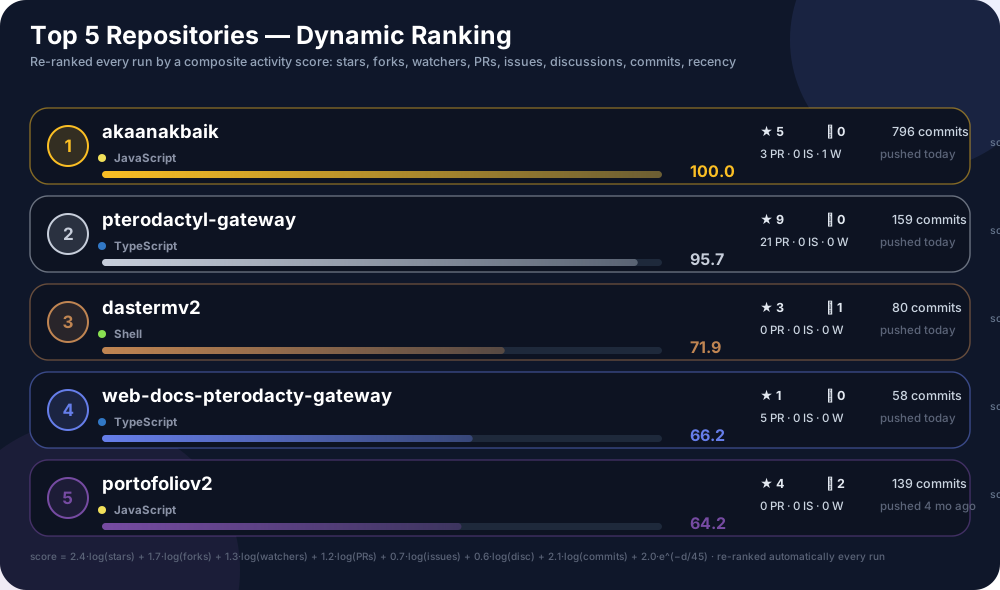
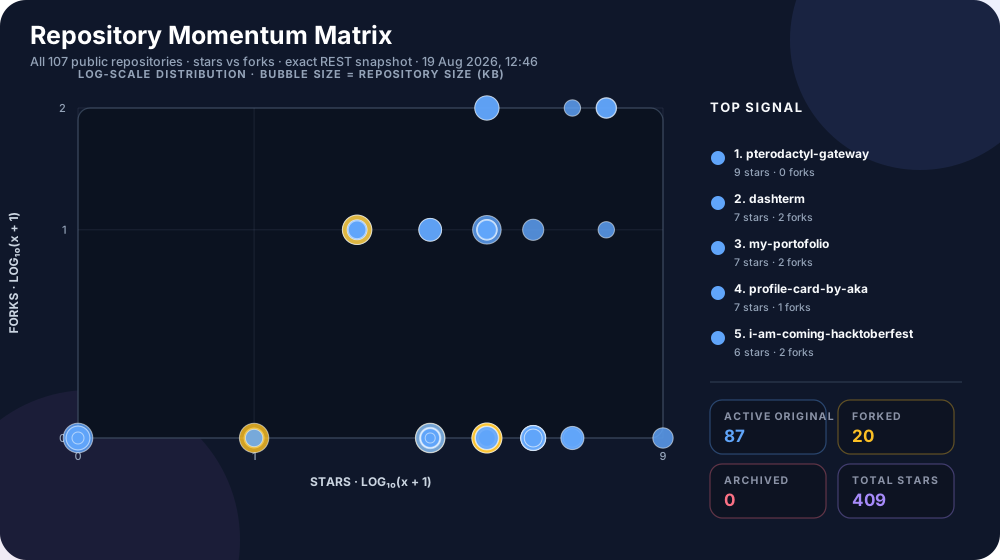
Ranking combines logarithmically scaled stars, forks, watchers, pull requests, issues, discussions, owned commits, and exponential push recency. The score is a transparent activity heuristic, not a popularity claim.
|
|
|


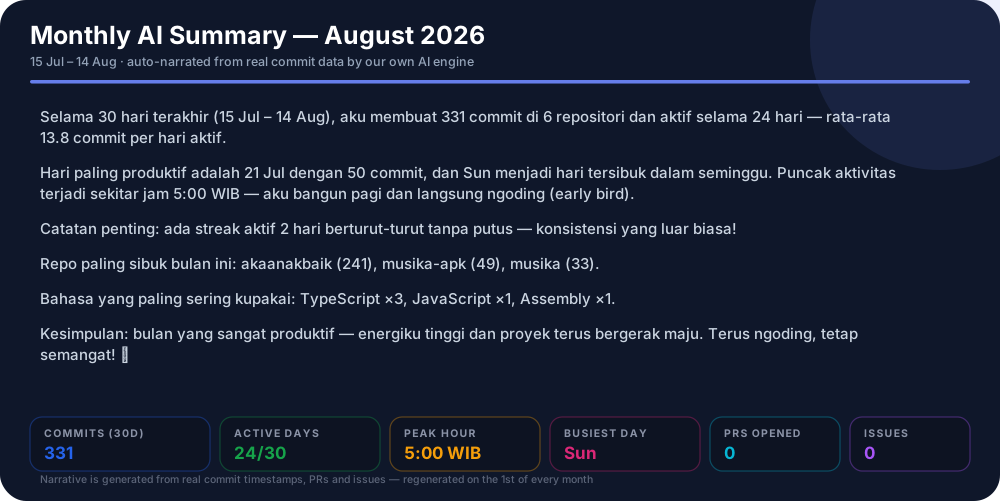


The rolling 30-day report is generated inside the same hourly snapshot as the other profile assets, with every activity date normalized to Asia/Jakarta so its badges and chart share one consistent publication point.

Working on   → Music Player Web App, Portfolio v2, Linux tools, AI tools, and bot systems
Learning     → React, Node.js, TypeScript, Docker, Cloud, DevOps, and AI Agents
Ask me about → JavaScript, Web Development, UI/UX, Linux, VPS, bots, and automation
Made with ❤️ by Aka